
As of the start of 2016, the program has moved to a monitoring, review and assessment phase. Maintenance work is now managed by local maintenance teams in line with the rest of the ARTC network.
The graph below shows the improvement over the last three years.
How to read the graph:
The graph below shows the transit time “lost” as a result of the current number of speed restrictions on the entire corridor between Melbourne and Sydney. The black and blue dash lines represent ARTC’s key performance indicators for freight services and passenger services respectively. The XPT line represents the NSW Trainlink passenger services which traverse from and to Sydney and Melbourne, i.e it does not reflect Vline services.
For information about passenger service reliability visit: www.nswtrainlink.info or www.vline.com.au
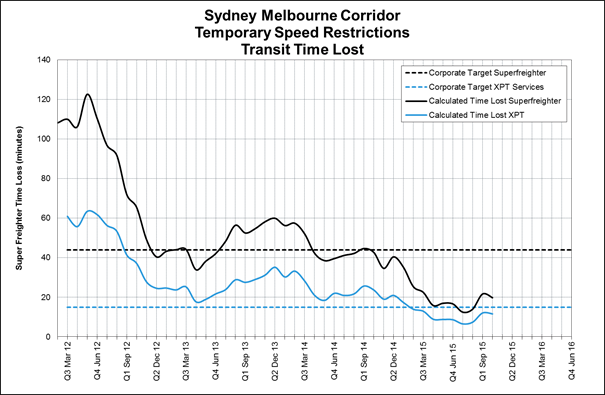
This indicator is the calculated theoretical transit time lost due to the imposed temporary speed restrictions between Sydney and Melbourne and the targets reflect ARTC’s corporate KPIs.